The ITSM Dashboard shows managers all KPIs quickly and accurately!
The ITSM Dashboard helps (IT) managers quickly gain insight into the performance of their organization. It is a practical steering tool to motivate and adjust service levels, processes, and their teams. In the dashboard, KPIs, performance, and improvement actions come together. As a result, mutual connections become visible.
Unique way
To steer effectively, current and accurate trend information is needed. The ITSM Dashboard uniquely links objectives, KPIs, working methods, team performance and improvement actions.
The ITSM Dashboard has a logical structure and provides quick insight into trends and their causes. We carry out dashboard innovations together with the users so that they are practical and quickly available.
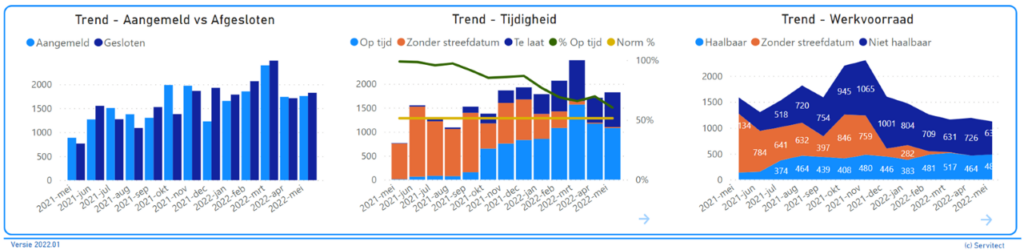
Organizations that use the dashboard see results in the short term and state that it has a sustained positive effect on the service, as in the following example: no more tickets without an end date (orange color), the workload decreases, and more reports are processed consistently.
Who
The dashboard is of great added value for managers who want to get a quick overview of the current performance, related to the organizational goals and potential improvement actions.
How
Through a well-thought-out design, this PowerBi report clearly displays the most important KPIs, performances, and actions.
Contact
If you have any questions about the ITSM Management Dashboard, please contact the supplier:
In the videos below we provide a demo of the ITSM Basic Dashboard and the extended dashboard. The “Working Method Dashboard” shown is one of the overviews available on the extended ITSM Dashboard. Additionally, in the second video, you can see how a quick analysis of the workload can be made. The ITSM Dashboards was previously called ISM Dashboard.